The Description view of the Results summary box allows you to search a result, add results to the patient record summary and filter the results by type. By filtering the results, you can print the list of results corresponding to your needs and display it in a graph and in a grid.
Access the Description view
Search for a result
Add a result to the summary
Filter results and display them in a list, a graph or a grid
Access the Description view
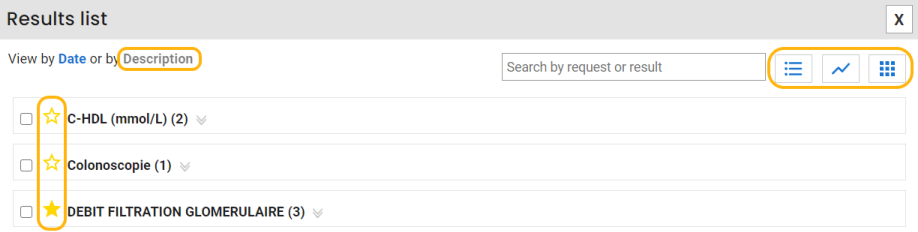
- Choose the Description filter at the top of the Results summary box of the patient record.

Search for a result
- Search for a term via the search bar in the upper right corner to filter the list of results:

- To view the results, follow the steps described in the Show the results section below.
Add a result to the summary
- Click on the star in front of the result groups to display in the record summary (right menu in the patient record). When the star is yellow, the results will be shown in the summary.

Filter and display the results (in a list, a graph or a grid)
The Description view also allows you to view results by order, in a chart, and in a grid. To do this, follow these steps:
1. Select the desired results;
a) Click the 3 horizontal bars to find all the orders associated with a result OR;

💡 By filtering the results and displaying them by prescription, you will be able to select the list of results obtained and print it easily.
Small tip: check the box of the first result in the list, then hold down the Shift key on your keyboard and select the last result, so the complete list of results will be selected.
(Video in French only)
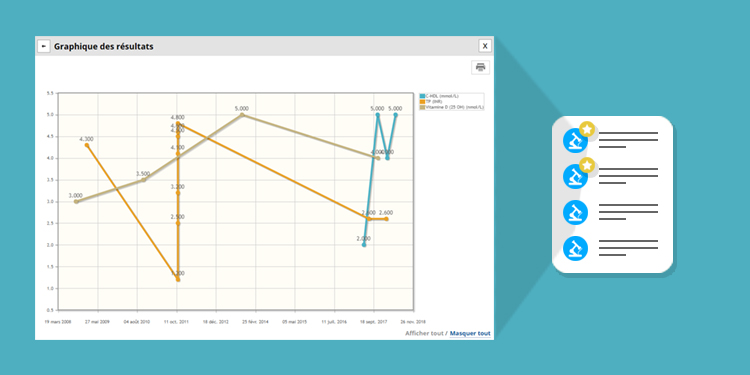
b) Click on the graph icon to display a trend curve OR;
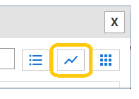

💡Print the graph and give it to the patient to demonstrate how their lifestyle changes or medication have an impact on their results.
c) Click on the small squares icon for the display in a table.